Page 3 – Reflection & Analytics
This page combines my personal reflection with the numbers behind my YouTube channel. It shows what I have learned emotionally from creating content, and what the analytics say about my growth from 2023 to 2026.
Personal reflection
When I started the ElectroSparklez channel, I was already struggling with strong social anxiety. While recording videos helped me practise speaking and expressing myself, this confidence exists mostly inside my online creative space. On my channel I feel energetic, engaged and able to be myself freely. However, in everyday life outside of YouTube I continue to experience significant anxiety. Leaving home often causes physical stress responses such as stomach pain, racing heart and tension, and in social environments I tend to be very quiet and withdrawn. This creates a sharp contrast between the confident, active version of me viewers see on screen and the much more anxious, reserved version that exists offline. Although YouTube has become my safest and most expressive outlet, the confidence I show there has not yet fully transferred into my real-world interactions.
I also realised how much work hides behind every video: planning, recording, editing, thumbnail design and understanding analytics. Even if a video does not perform well, the process of creating it teaches me new skills in video production, design and time management.
Lifetime channel overview
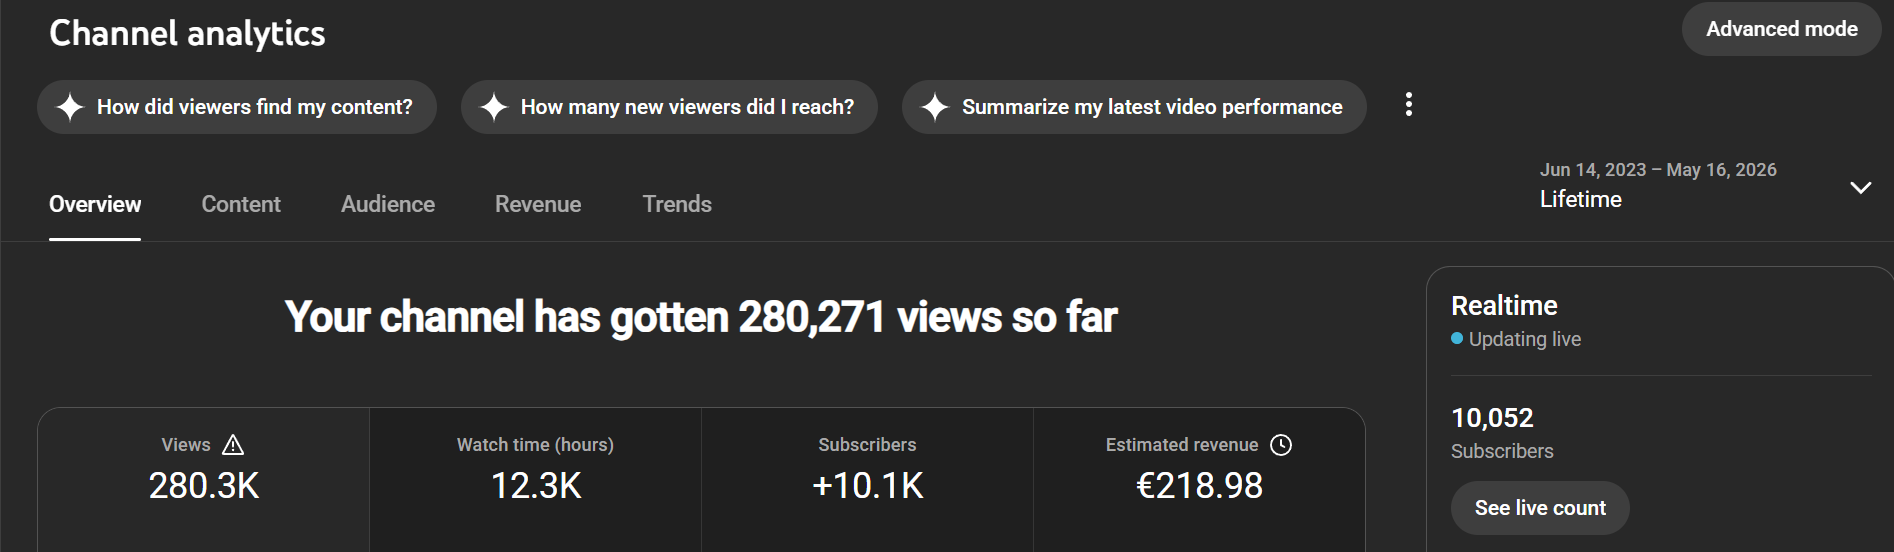
Over the lifetime of the channel, I have reached around 280,000 views, more than 12,300 hours of watch time and gained over 10,000 subscribers. For a channel built as a hobby, this is a result I am proud of.
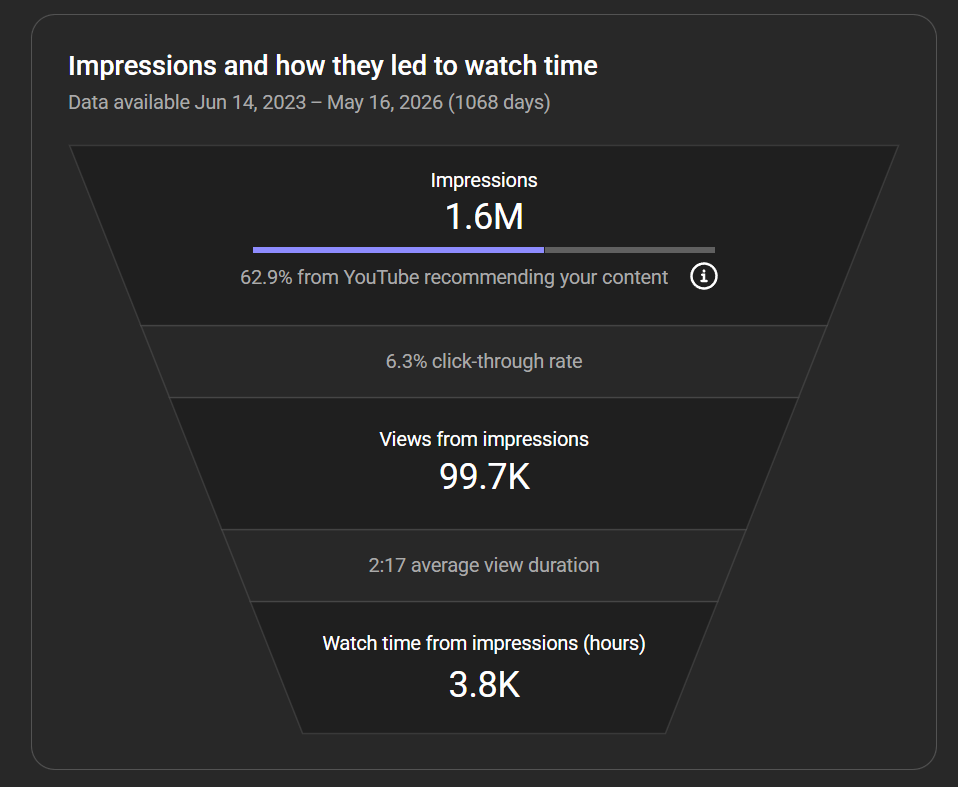
The lifetime impressions funnel now shows about 1.6 million impressions with a click-through rate of 6.3%. About 62.9% of those impressions come from YouTube recommending my content rather than from direct searches. This confirms that my channel is heavily dependent on the recommendation algorithm: most viewers discover me for the first time through suggested videos.
Average view duration on the lifetime graph is around 2 minutes 17 seconds, which is normal for gaming content with mixed video lengths. It tells me that some viewers watch only for the key moments, while others stay for longer gameplay.
Current state – February to May 2026
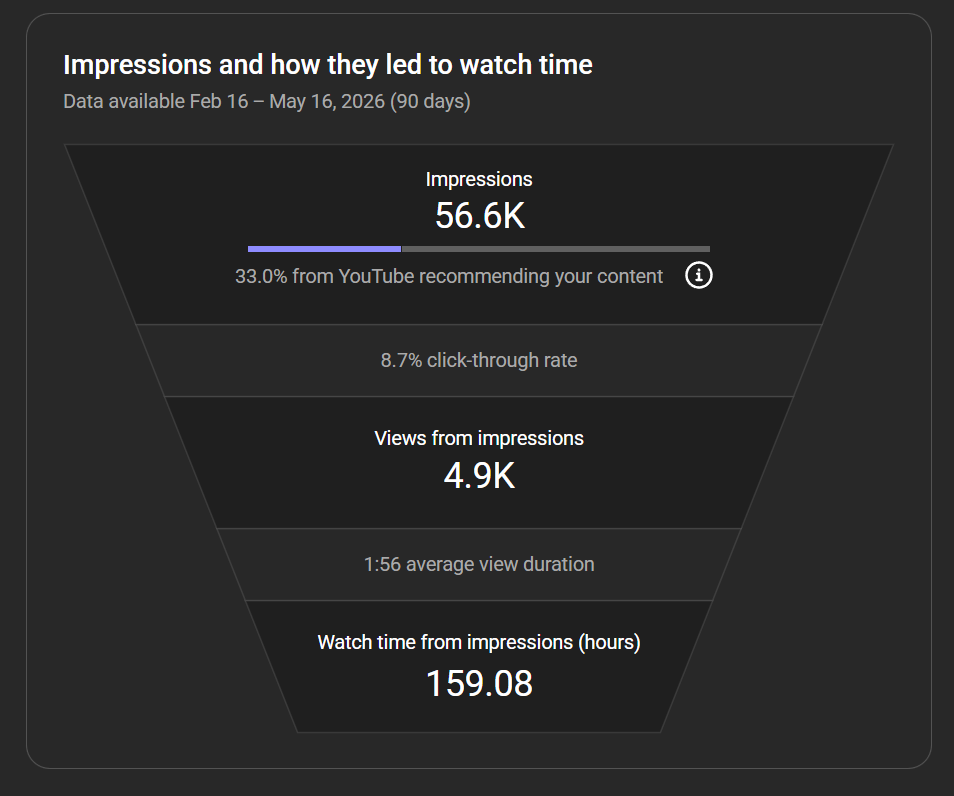
The last 90 days — covering the period where I have not been uploading — show 56,600 impressions with a click-through rate of 8.7% and about 4,900 views generated from those impressions. Average view duration is 1 minute 56 seconds, resulting in around 159 hours of watch time across this period.
The numbers are lower than previous periods, and the reason is straightforward: I have not uploaded anything for around two and a half months. University workload and stress directly affected my motivation and mental state, and I cannot create content when I am feeling anxious or low. This is something I think is worth being honest about — YouTube is often presented as a passion that runs on autopilot, but for me it requires energy and a stable headspace. When university takes that away, the channel goes quiet. It shows how closely creative output is tied to mental health, and how external pressure from academic life can interrupt something that otherwise brings me genuine joy.
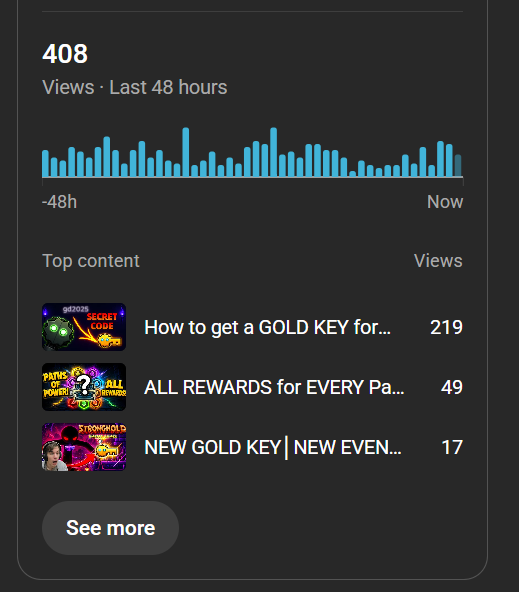
Despite not uploading recently, the channel still receives around 400 views every 48 hours from older videos that performed well and continue to be recommended. This is a good example of how a strong backlog of content can compensate during periods of inactivity — past videos keep working even when I am not. That said, this passive reach has limits. Returning with new uploads is still important, both to maintain the channel's momentum and because creating is something I genuinely want to come back to when the conditions are right.
What these numbers mean to me
Looking at the full picture, the channel is in a genuinely strong position for what it is. Reaching 280,000 views, 10,000 subscribers, and 1.6 million impressions as a solo hobby creator with no team, no sponsorships, and no viral moments outside of organic recommendations is a real achievement. The 6.3% lifetime click-through rate is also notably above average — it tells me that the thumbnail and title work I put in actually matters and is paying off.
The most interesting tension in the data is the algorithm dependency. Around 63% of lifetime impressions come from YouTube recommending my content, which means the channel lives and dies by the algorithm's decisions. That is both a strength and a vulnerability — when a video catches, it gets pushed hard; when nothing new is uploaded, reach drops quickly. The 90-day inactive period makes this very visible: impressions fell significantly without new content to feed the system. The backlog kept views coming in passively, but the algorithm clearly prefers active channels.
What the numbers also quietly reveal is something more personal: this channel is deeply tied to my mental state. The gap in uploads is not laziness — it is a direct reflection of what university pressure and anxiety do to creative motivation. I think that is worth naming honestly, because it is a reality many creators face but rarely talk about. The analytics show a pause; the reason behind it is human.
Overall I am proud of what these numbers represent. Not because they are impressive by industry standards, but because they were built entirely from genuine interest, trial and error, and a willingness to keep going even when things did not perform. That feels like the right foundation to build on.